My true passions and skill sets lie as a
Data Translator & in Customer Success
I have a strong desire to help businesses uncover meaningful trends and patterns
which will lead to increased sales revenue, improved application performance,
and appropriate customer targeting and recommendations.
Data Visualization
Capable of making graphical representation of information and data using charts, graphs, and maps to display meaningful trends, outliers, and patterns.
Data Cleaning
Proficient at identifying inaccurate or corrupt data from record sets, tables, or databases and then replacing, modifying, or deleting the bad data.
Web Scraping
Experienced with extracting large amounts of web data, and storing it in tables or databases, from websites that do not provide the direct functionality to copy the information.
Programming Languages
Highly adept in Python for data analysis/visualization, SQL query writing, HTML/CSS web development, and Excel VBA as well as pivot tables.

Earthquake Data Viz
In this project, I built a set of tools that visualizes United States Geological Survey (USGS) earthquake data. The USGS collects a massive amount of data from all over the world each day and the visualization I created tells an interesting story about earthquake activity around the world. Important policy and funding decisions that impact the public's health and safety use the USGS data.

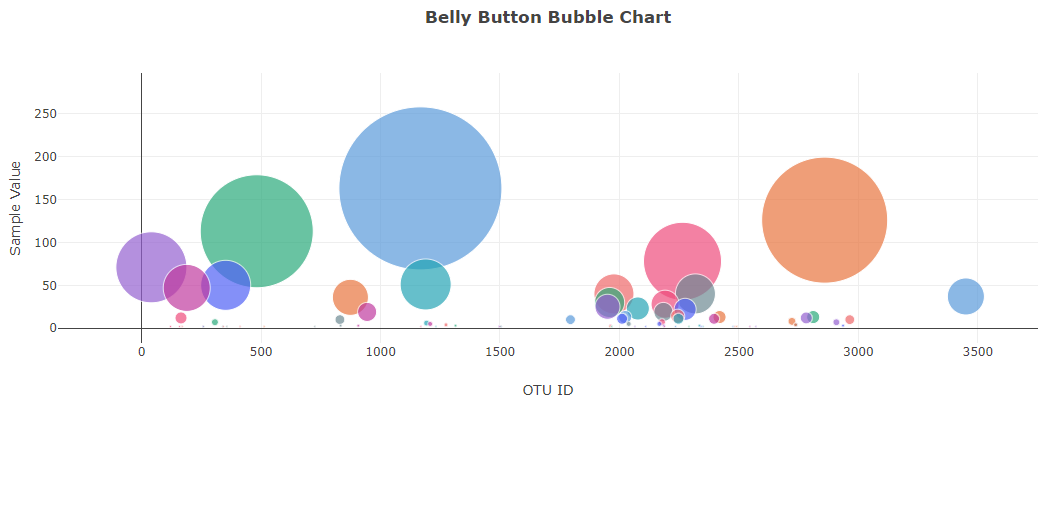
Belly Button Biodiversity
In this project, I built a fully functional website with an interactive dashboard to explore the Belly Button Biodiversity dataset, which catalogs the microbes that colonize human navels. The dataset reveals only a small handful of microbial species (also called operational taxonomic units, or OTUs) were present in more than 70% of people, while the rest were relatively rare.

Weather Impact Study
In this team project, we analyzed the impact of home sales in Indiana based on weather. We looked at dates, temperature changes, conditions, buyer location per county, sale prices, population count, household income and median home value. The Extract-Transform-Load (ETL) process was achieved using python (extract), pandas (transfrom), and SQLAlchemy (load) to eventually store the cleaned data into PostgreSQL.

Honey Bee Tableau Viz
In this project, I built a Tableau Story consisting of nine different dashboards displaying the changes in honey production (lbs.), honey value ($), and acres bearing almonds. The honey bee story looks at the national and state levels with additional insight at the county level for Indiana.